

This set of statistics has been discontinued.
Statistical data on this topic are published in connection with another set of statistics.
Data published after 5 April 2022 can be found on the renewed website.
Published: 9 May 2019
Women completed nearly 60 per cent of all university degrees in 2018
Corrected on 29 October 2019. The corrections are indicated in red.
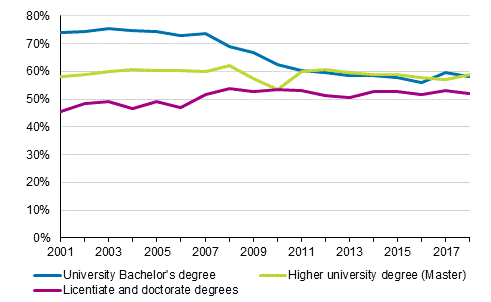
According to Statistics Finland's Education Statistics, around 30,800 university degrees were completed in 2018, which is just under 250 fewer than in the previous year. For the third successive year, the number of lower university degrees decreased, by three per cent year-on-year. By contrast, slightly more higher university degrees and doctorate degrees were completed than in the year before. Women's share of all those who had completed a university degree was 58 per cent and 51 per cent of those who had completed a doctorate degree.
Women's share of all completed university degrees 2001–2018, per cent
Foreigners completed 25 per cent of doctorate degrees (corrected on 29 October)
In 2018, around 13,600 lower university degrees, slightly under 15,300 higher university degrees, 75 licentiate degrees and around 1,800 doctorate degrees were completed. Most students graduated in the field of business, administration and law, where close on 18 per cent of all degrees were completed. Good 15 per cent of degrees were completed in arts and humanities and close on 14 per cent in both social sciences and engineering, manufacturing and construction. Most doctorate degrees were completed in the fields of health and welfare, around 23 per cent of all doctorate degrees, and in engineering, manufacturing and construction, where around one-fifth of all completed doctorate degrees were completed.
Around 8 per cent degree was attained by foreign students, the figure being 12 per cent for higher university degrees and 25 per cent for doctorate degrees. Foreign students completed most degrees in relative terms in the field of information and communication technologies, 20 per cent of all university degrees in this field. The share of doctorate degrees completed by foreigners was highest in the fields of natural science, mathematics and statistics, information and communication technologies and agriculture, forestry, fisheries and veterinary, where foreigners completed over one-third of the doctorate degrees in each field.
Examined by university, the highest numbers of degrees were completed at the University of Helsinki, good 5,500. The second most degrees were completed at the University of Turku, some 3,700 and the third most at the University of Eastern Finland, just under 3,200. The least number of degrees were completed at the National Defence University, 275 degrees and the University of the Arts Helsinki, close on 450 degrees.
More new students and new foreign students than in the previous year
In 2018, a total of good 26,200 new students started studies, which is almost six per cent more than one year previously. The number of new students studying for higher university degrees grew by nearly 13 per cent and that of new students studying for lower university degrees increased by four per cent. However, the number of new doctoral programme students decreased by nearly eight per cent year-on-year. The number of new foreign university students grew by nearly one-fifth from the previous year. The share of foreigners among all new students was around ten per cent.
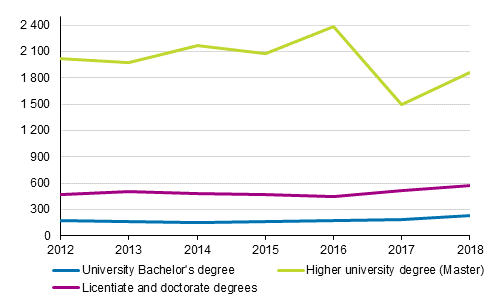
New foreign university students in 2012 to 2018
In 2018, a total 153,400 students were studying at universities, which is roughly the same amount as in the previous year. In all, 77,000 students were studying for a lower university degree and 58,000 for a higher university degree. There were 18,300 post-graduate students, of whom good 800 were studying for a licentiate degree and around 17,500 for a doctorate degree.
In 2018, the highest numbers of students were studying in the field of arts and humanities, 17 per cent. The second most students were studying in the fields of business, administration and law and engineering, manufacturing and construction, around 15 per cent of all students. The proportion of women of all students attending education leading to a degree was 54 per cent but the variation was large between fields of education. Good four out of five students in education were women, while in the field of information and communication technologies (ICT), the proportion of women was slightly over 20 per cent and in the field of engineering, manufacturing and construction around 25 per cent. In contrast, both sexes represented around one-half of students in business, administration and law, and natural sciences, mathematics and statistics.
The number of students was highest at the University of Helsinki, close on 31,300. The second most students were found at Aalto University, nearly 17,500, and the third most at the University of Turku, good 16,100. More detailed time series data on university students and degrees by education and university are available in the tables in databases .
Source: Education. Statistics Finland
Inquiries: Jukka Jalolahti 029 551 3588, koulutustilastot@stat.fi
Director in charge: Jari Tarkoma
Publication in pdf-format (285.8 kB)
- Tables
-
Tables in databases
Pick the data you need into tables, view the data as graphs, or download the data for your use.
Appendix tables
- Appendix table 1. Students in universities and completed university degrees by level of education, fields of education (National classification of education 2016) and gender in 2018 (9.5.2019)
- Appendix table 2. Foreign students in universities and completed university degrees by level of education, fields of education (National classification of education 2016) and gender in 2018 (Corrected on 29 October 2019) 1) (9.5.2019)
Updated 9.5.2019
Official Statistics of Finland (OSF):
University education [e-publication].
ISSN=2324-0148. 2018. Helsinki: Statistics Finland [referred: 23.7.2026].
Access method: http://stat.fi/til/yop/2018/yop_2018_2019-05-09_tie_001_en.html