

1. Sector-specific review on the data for the second quarter of 2013
1.1. Households' adjusted real income grew slightly
The disposable income of households grew in the second quarter of 2013 by around EUR 0.7 billion, or by nearly three per cent compared to the corresponding quarter in 2012. The key components of disposable income on the revenue side are wages, salaries, entrepreneurial income and property income and social benefits received. The biggest expense items are taxes paid and social contributions.
Figure 1. Components of household sector adjusted disposable income
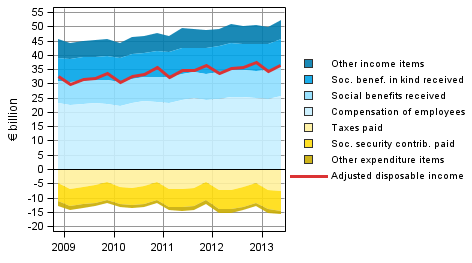
Compared to the figures one year ago, disposable income grew most due to a growth of EUR 0.4 billion in wages and salaries and of EUR 0.6 billion in social benefits received. Entrepreneurial income also grew compared with the corresponding quarter of the previous year. On the expense side, income taxes paid grew by EUR 0.4 billion, while no significant changes took place in the other expense items. Both interest income and expenses diminished from the corresponding quarter of one year before.
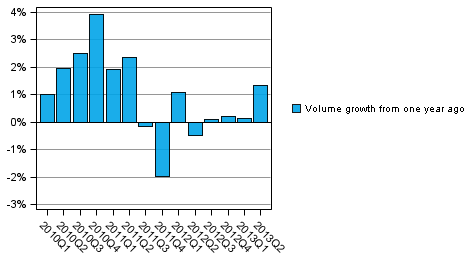
When received social benefits in kind are added to the disposable income of households, the household adjusted disposable income is derived, which is the indicator recommended by the OECD for measuring economic well-being. Social benefits in kind refer to education, health and social services produced by general government and non-profit institutions serving households. The real growth in adjusted disposable income has been minimal over the past year, but in the second quarter the volume grew again by good one per cent from the corresponding quarter of the previous year. The volume indicator describing the development of adjusted disposable income adjusted for price changes can be found in Appendix Table 3 of this publication.
Figure 2. Volume development of households' adjusted disposable income
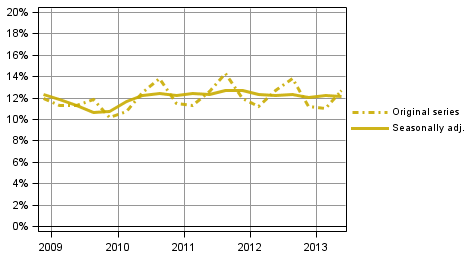
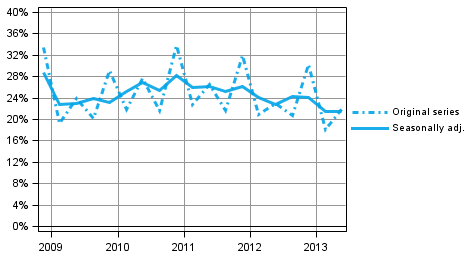
Households' seasonally adjusted saving rate was 3.3 per cent in the second quarter of 2013. In the previous quarter, it stood at 1.4 per cent. The saving rate has mostly been growing for several years. The saving rate is derived by deducting consumption expenditure from disposable income. The saving rate is negative if households' consumption expenditure is higher than their disposable income. In the second quarter of 2013, the investment rate of households accounted for 12.1 per cent of their disposable income, slightly less than in the previous quarter. Most of households' investments were investments in dwellings.
Figure 3. Households' saving rate
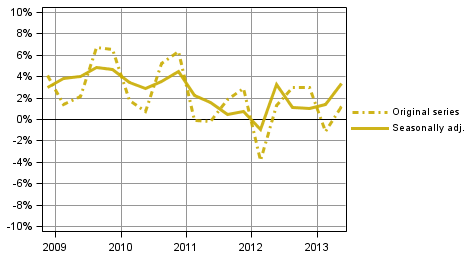
Figure 4. Households' investment rate
Wages and salaries paid by non-profit institutions serving households increased by good two per cent compared with the quarter of one year ago.
In these statistics, the households sector only covers the actual households sector S14. Sector S15, non-profit institutions serving households is calculated and published separately. In Eurostat’s publication, the households sector also includes the data for sector S15. Another difference to Eurostat's publication is in how consumption of fixed capital is taken into account: Eurostat publishes investment and saving rates as gross figures, i.e. including consumption of fixed capital. Net data are used in these statistics, that is, when consumption of fixed capital is taken into account, saving and investment rates decrease.
1.2. Profits in the non-financial corporations sector on level with the previous quarter
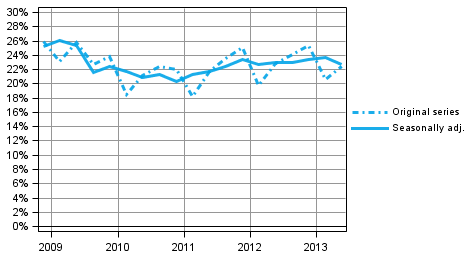
In the second quarter of 2013, the profit share of non-financial corporations, or the share of profits in value added, was seasonally adjusted 21.6 per cent, the same as in the previous quarter. The profit share is mainly determined based on the development of value added. Compensation of employees develops more evenly, so fluctuations in value added are visible in profits.
Figure 5. Non-financial corporations' profit share
The investment rate of non-financial corporations, or the proportion of fixed capital investments in value added, fell seasonally adjusted from the previous quarter. In the second quarter of 2013, the investment rate was 22.7 per cent while the corresponding figure was 23.7 per cent one year ago.
Figure 6. Non-financial corporations' investment rate
The low general level of interest rates is visible in the financial and insurance sector. The gross value added of the sector fell in the second quarter by six per cent compared with the second quarter of last year, because intermediate consumption grew faster than output. The amount of compensation of employees was around two per cent lower than in the year before. The operating surplus describing profits showed a fall of around 18 per cent. Holding gains and losses generated through own securities trading are not visible in the value added and operating surplus; they describe the income that is generated from providing financial services to the public. In the second quarter, the property income in the sector was 14 per cent lower and property expenditure was five per cent lower than in the second quarter of last year. The deviating development of property expenditure from income is explained by the fact that part of dividends paid were divided between quarters differently from last year.
1.3. Financial position of general government weakened further
General government unconsolidated total revenue was EUR 1.0 billion higher in the second quarter of the year than a year ago. Total expenditure in turn increased by EUR 1.4 billion. General government is comprised of central government, local government and social security funds. Unconsolidated total revenue and expenditure are figures in which flows between the general government sub-sectors have not been eliminated.
Figure 7. Components of general government sector net lending
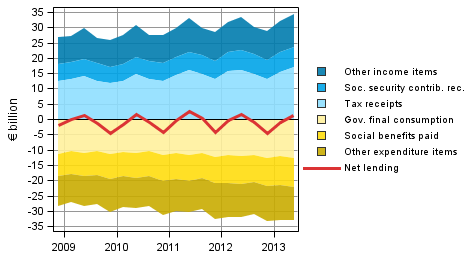
The general government surplus (net lending), which is formed as the difference between the total revenue and expenditure, decreased by EUR 0.4 billion from one year back. The financial position was particularly weakened due to the growth of EUR 0.6 billion in social benefits paid and of EUR 0.3 billion in current transfers paid. Of the biggest items on the revenue side, tax revenue grew by EUR 0.9 billion, while property income contracted by EUR 0.2 billion from one year back.
Of the sub-sectors, the financial position of social security funds weakened, while the financial position of central government and local government improved slightly. More detailed statistics, where the sub-sectors are specified, are published in the quarterly sector accounts of general government: http://www.stat.fi/til/jtume/index_en.html .
1.4. Foreign trade showed a surplus in the second quarter
The essential items for the rest of the world sector are exports and imports of goods and services. Exports at current prices abroad from Finland amounted to EUR 19.0 billion in the second quarter of 2013. Exports of goods decreased by three per cent and those of services by good one per cent year-on-year. Exports decreased particularly for electronic products and basic metals and increased for metal products.
Figure 8. Components of the balance of goods and services in foreign trade (from the perspective of the rest-of-the-world sector)
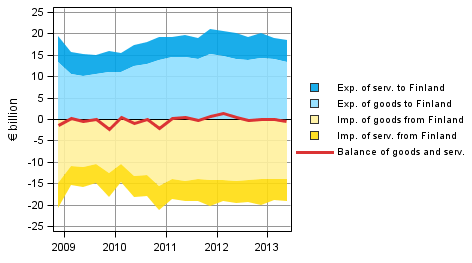
Note: Figures may differ from Bank of Finland's balance of payments figures due to differences in compilation schedules. This regards especially the latest quarters.
Imports at current prices to Finland were EUR 18.5 billion in the second quarter of 2013. Imports of goods contracted by six per cent and those of services by ten per cent from one year ago. Imports decreased most for electronic products and metal ores. Imports of motor vehicles grew most.
The balance of goods and services thus showed a surplus of EUR 0.5 billion in the second quarter of 2013. One year ago, the balance showed a deficit of EUR 0.4 billion. The deficit of current account also fell, but only by EUR 0.5 billion, because the growth in the balance of goods and services was compensated by other items, particularly by current transfers paid from abroad to Finland.
Figure 9. Components of the current account balance in foreign trade (from the perspective of the rest of the world sector)
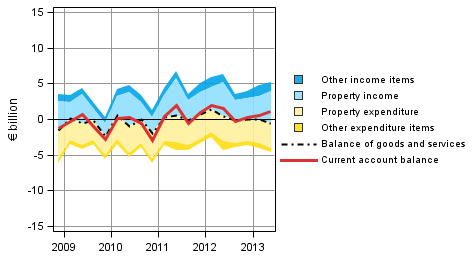
Note: Figures may differ from Bank of Finland's balance of payments figures due to differences in compilation schedules. This regards especially the latest quarters.
1.5. Data and methods used
The quarterly data become revised as source data are updated. The strongest revision will occur for the latest two to three years, because then the data in the annual national accounts are still preliminary. Examined by quarter, the biggest revisions take place in the release for the second quarter at the turn of September and October, when the most recent data of annual national accounts from July are available for the first time. The data in the publication are based on the data sources available by 20 September 2013. The data for 1999 to 2012 correspond with the annual sector accounts of the national accounts, although concerning the year 2012, the updating of source data causes differences to the previous release of annual national accounts.
The savings rate, profit share and investment rate in the quarterly publication of sector accounts are net amounts, i.e. consumption of fixed capital has been removed from the figures. The key indicators in these statistics were calculated as follows:
Households' saving rate = B8N / (B6N+D8R)
Households' investment rate = P51K / (B6N+D8R)
Profit share of non-financial corporations = B2N / B1NPH
Investment rate of non-financial corporations = P51K / B1NPH
The volume indicator, which measures the development of household adjusted disposable income adjusted for price changes and its change percentages, can be found in Appendix Table 3 of this release. This volume index is calculated using the price data of the statistics on quarterly accounts, with which the components of adjusted disposable income are deflated. Household disposable income is deflated with the implicit price index of household consumption expenditure. Price data are also available for the consumption of non-profit institutions serving households. As a methodological shortcoming, general government individual consumption expenditure has to be deflated with the total general government consumption expenditure for lack of more accurate data. The volume time series was formed with the annual overlap method.
Source: Sector accounts, Statistics Finland
Inquiries: Jesse Vuorinen 09 1734 3363, Katri Soinne 09 1734 2778, skt.95@stat.fi
Director in charge: Leena Storg�rds
Updated 30.9.2013
Official Statistics of Finland (OSF):
Quarterly sector accounts [e-publication].
ISSN=2243-4992. 2nd quarter 2013,
1. Sector-specific review on the data for the second quarter of 2013
. Helsinki: Statistics Finland [referred: 12.4.2026].
Access method: http://stat.fi/til/sekn/2013/02/sekn_2013_02_2013-09-30_kat_001_en.html